Log in
Email
Password
Register
Menu
Explore
Newest photos
Popular photos
Contribute
Submission guidelines
Photographer signup
Photographer login
About
About Freerange
Image license
API
Contact us
Support
Contact support
FAQ
Login
Login
Register
Search all
Photos
Illustrations
Match All
Match Photo ID
Newest
Popular
Select Category
AI Generated
CC0 Images
Editorial and News
Animals & Insects
Architecture
Architectural Details
Arts & Music
Backgrounds & Textures
Cities and Modern Life
Business & Office
Flowers and Plants
France
Food & Drink
Holidays & Occasions
Health and Fitness
Landmarks
Interiors
Illustrations
Industry & Agriculture
Landscapes & Nature
Letters and Numbers
Objects
Other
Military
People
Signs & Symbols
Sky and Clouds
Space
Sports & Recreation
Technology
Wallpapers
Free Stock Images
Sponsored images from Shutterstock
View footage results
Click to save 15% sitewide with code
FREERANGE15OFF
View More
74 free statistics charts photos from Freerange
Filter results
Popular
Most Viewed
Newest Photos
All licenses
Freerange
CC0
Photos & Illustrations
Photos
Illustrations
Per Page
25
50
100
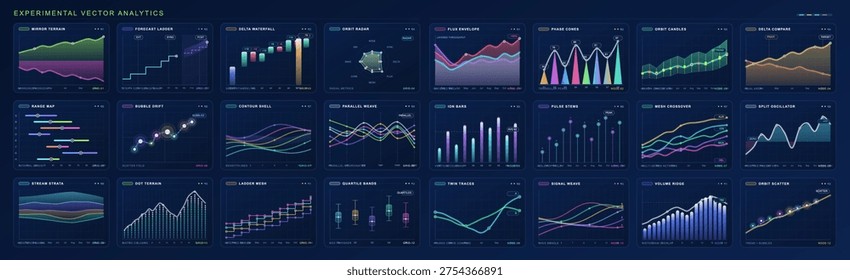
Data Analytics Concept
Data Analytics Concept
Medical Technology - MedTech Market - Healthcare
Medical Technology - MedTech Market - Healthcare
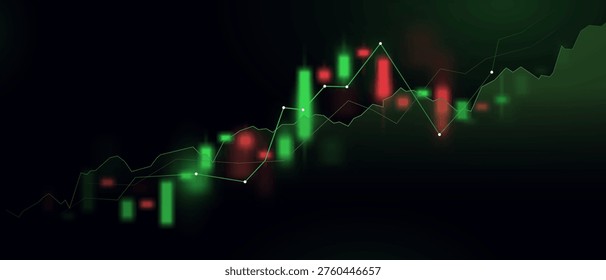
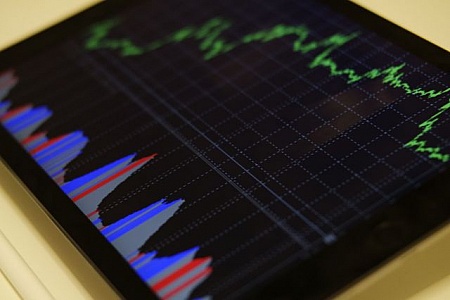
Stock market trend shows significant decline in value
A digital graph displays a sharp downward trend in stock values, indicating market volatility and investor concern.
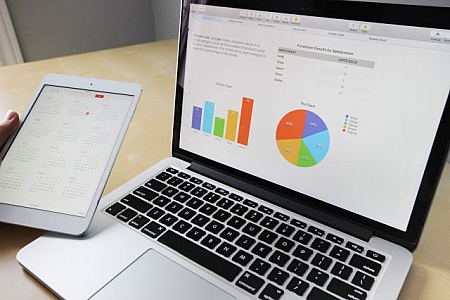
Analyzing digital statistics on laptop and tablet
This image shows a professional comparison of digital statistics on a laptop and tablet, highlighting data analysis
Finance Professional - Broker - Financial Advisor - Analyst - CF
Finance Professional - Broker - Financial Advisor - Analyst - CFA - Investor - Activist - Trader - With Copyspace
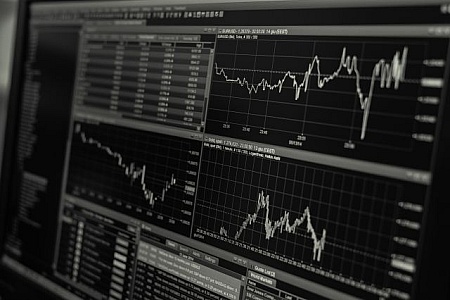
Multiple financial graphs on a computer screen displaying data trends.
This image shows several financial graphs on a computer screen, illustrating various data trends and market analyses. It conveys a sense of precision and analytics, portraying the dynamic nature of financial markets in a detailed, professional manner.
Finance Professional - Broker - Financial Advisor - Analyst - CF
Finance Professional - Broker - Financial Advisor - Analyst - CFA - CFO - Investor - Activist
Finance Professional - Broker - Financial Advisor - Analyst - CF
Finance Professional - Broker - Financial Advisor - Analyst - CFA - CFO - Investor - Activist - With Copyspace
Medical Technology Concept - Beating Heart - Cardiology - Health
Medical Technology Concept - Beating Heart - Cardiology - Healthcare
Healthcare Technology Concept
Healthcare Technology Concept, Human Body
Computer Screen Displaying Multitude of Data
A computer screen shows a large amount of data, including charts, graphs, tables, and text. The data appears to be related to analytics, statistics, or research.
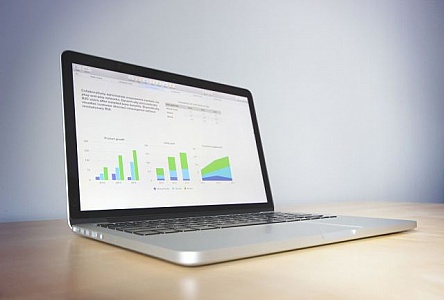
Laptop with graphs and charts on screen
Open laptop with financial graphs and charts displayed on screen suggesting productivity and analysis
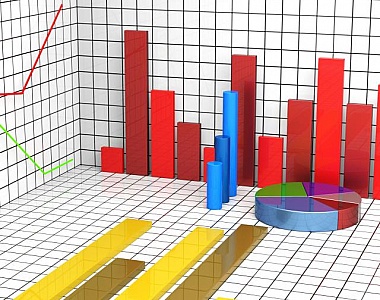
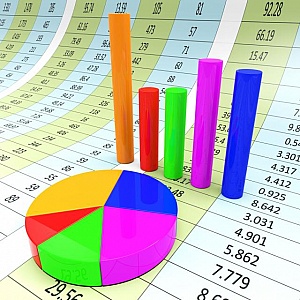
Statistics Charts Represents Graph Graphs And Infochart
Statistics Charts Meaning Stats Statistical And Diagram
Statistics and Figures - Data Analytics Concept
Statistics and Figures - Data Analytics Concept
Man analyzing data on tablet
Professional analyzing business data on a digital tablet Includes pie charts and graphs
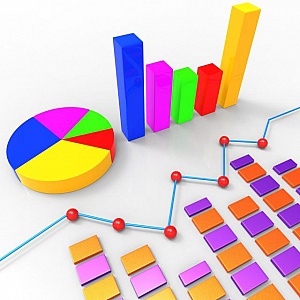
Statistics Data Indicates Stats Bytes And Reports
Stats Data Representing Statistical Analysis And Facts
Medical Technology Concept - Cardiology - Bionics - Healthcare.j
Medical Technology Concept - Cardiology - Bionics - Healthcare - With Copyspace
Charts and infographics on desk
Worker looking at infographics, charts and graphs on paper, with smartphone.
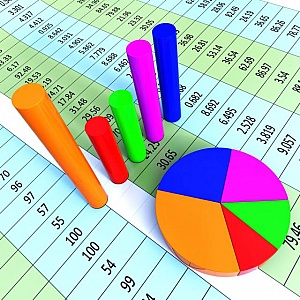
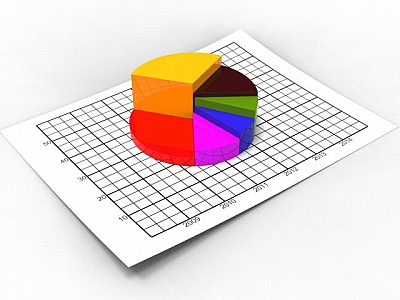
Pie Chart Indicates Financial Report And Charts
Pie Chart Showing Business Graph And Graphic
Statistics Stats Means Report Bytes And Analysing
Data Statistics Representing Analyse Stats And Report
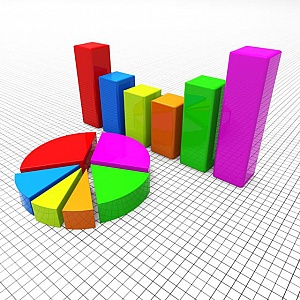
Graph Report Shows Statistic Statistics And Infochart
Graph Report Meaning Data Investment And Analysis
Graph Report Represents Trade Corporate And Finance
Graph Report Meaning Information Financial And Commercial
Graph Report Represents Trend Graphics And Finance
Graph Report Indicating Trend Analysis And Biz
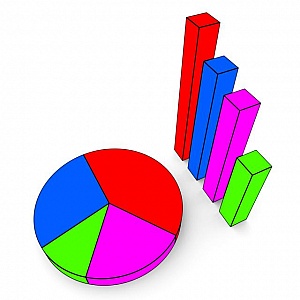
Pie Chart Shows Business Graph And Charting
Pie Chart Indicating Business Graph And Statistic
Stock market graphs on a digital tablet screen
A digital tablet displaying colorful stock market graphs and trends, indicating financial analysis and investments
Reports and metrics
Smartphone with paper reports with graphs of performance.
Calculate Statistics Shows Calculated Data And Statistical
Calculate Statistics Representing Chart Computes And Calculates
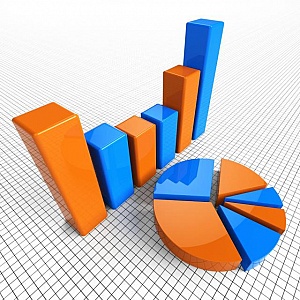
Profit Charts Represents Earnings Graphics And Graph
Profit Charts Indicating Business Graph And Lucrative
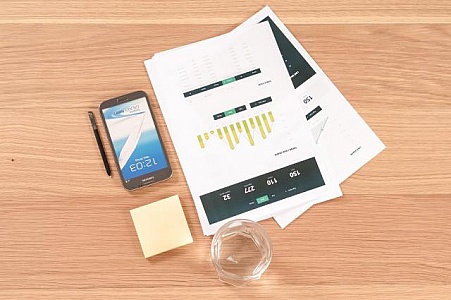
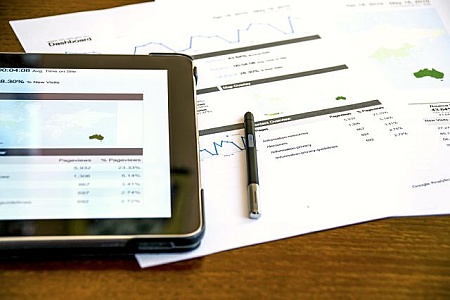
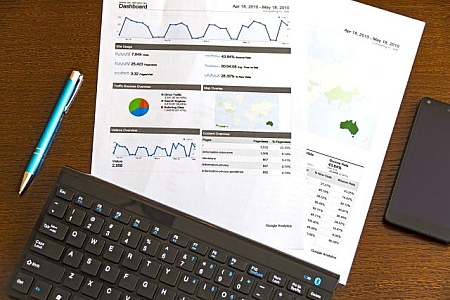
Tablet and printed reports on a wooden office desk
The image captures a tablet displaying data, alongside printed reports and a pen on a wooden desk, symbolizing modern business analytics and digital technology in an office setting.
Graph Report Indicates Business Statistic And Diagram
Graph Report Meaning Commerce Data And Diagram
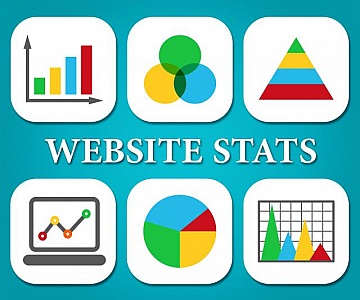
Website Stats Means Business Graph And Analysis
Website Stats Indicating Business Graph And Report
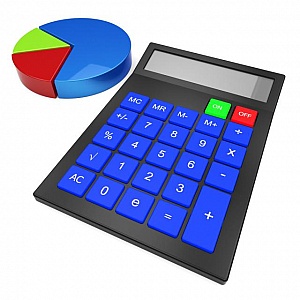
Calculate Statistics Means Charting Figures And Calculator
Calculate Statistics Showing Data Computes And Figures
Analytics Charts Represents Business Graph And Statistics
Analytics Charts Indicating Business Graph And Forecast
Two mobile devices and reprorts
Two mobile smartphones and a pile of business metric reports.
Pie Chart Indicates Forecast Statistics And Figures
Pie Chart Showing Business Graph And Graphic
Graph Report Shows Graphs Charts And Infochart
Graph Report Representing Financial Corporate And Analysis
Man reading financial news on newspaper
A well-dressed man holding a business newspaper with visible financial news and charts analytics
Forcasting Charts Shows Business Graph And Statistic
Forcasting Charts Indicating Business Graph And Statistics
Pie Chart Shows Business Graph And Charting
Pie Chart Indicating Business Graph And Charts
Graphs Charts Means Infochart Statistics And Forecast
Graphs Charts Representing Statistic Statistical And Forecast
Pie Chart Shows Business Graph And Charting
Pie Chart Representing Business Graph And Statistical
Pie Chart Shows Statistical Graphs And Graphics
Pie Chart Meaning Business Graph And Statistics
Pyramid vector icons
Pyramid vector icons on white background
Stock market analysis using trading software during a busy weekday
A person analyzes stock market trends on a computer screen filled with intricate graphs and data. The digital display shows fluctuating prices and trading volumes during the day.
Printed analytical charts and graphs with a black keyboard
Printed charts and graphical analytics on paper lie on a wooden desk alongside a black keyboard and a pen, representing data analysis, business planning, and strategy.
Tablet displaying analytics data with coffee nearby.
A tablet displaying comprehensive analytics data including charts and graphs, with a smartphone and a cup of coffee nearby, ideal for business or marketing analysis.
Graph Report Indicates Diagram Charts And Analysis
Graph Report Meaning Infograph Commercial And Profit
Graph Report Represents Trend Graphics And Finance
Graph Report Indicating Trend Analysis And Biz
Pie Chart Shows Business Graph And Biz
Pie Chart Representing Business Graph And Diagram
Graph Report Indicates Finance Business And Data
Graph Report Showing Statistic Infograph And Trade
Find even more royalty free stock photos from the world's best photographers
View
of
2
Try your search on Shutterstock: