Log in
Email
Password
Register
Menu
Explore
Newest photos
Popular photos
Contribute
Submission guidelines
Photographer signup
Photographer login
About
About Freerange
Image license
API
Contact us
Support
Contact support
FAQ
Login
Login
Register
Search all
Photos
Illustrations
Match All
Match Photo ID
Newest
Popular
Select Category
AI Generated
CC0 Images
Editorial and News
Animals & Insects
Architecture
Architectural Details
Arts & Music
Backgrounds & Textures
Cities and Modern Life
Business & Office
Flowers and Plants
France
Food & Drink
Holidays & Occasions
Health and Fitness
Landmarks
Interiors
Illustrations
Industry & Agriculture
Landscapes & Nature
Letters and Numbers
Objects
Other
Military
People
Signs & Symbols
Sky and Clouds
Space
Sports & Recreation
Technology
Wallpapers
Free Stock Images
Sponsored images from Shutterstock
View footage results
Click to save 15% sitewide with code
FREERANGE15OFF
View More
139 free infochart photos from Freerange
Filter results
Popular
Most Viewed
Newest Photos
All licenses
Freerange
CC0
Photos & Illustrations
Photos
Illustrations
Per Page
25
50
100
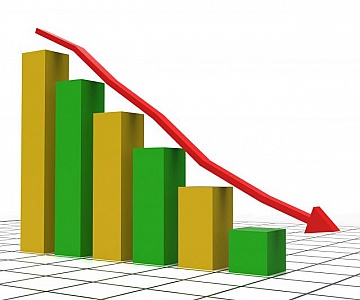
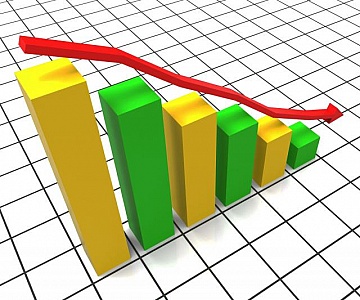
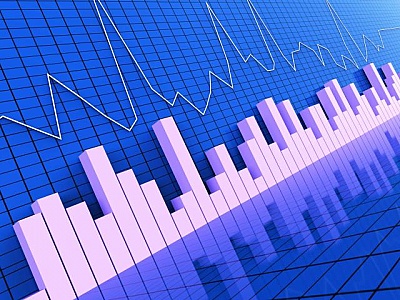
Decreasing Report Shows Graphic Analysis And Graphs
Decreasing Report Meaning Graphic Statistics And Trend
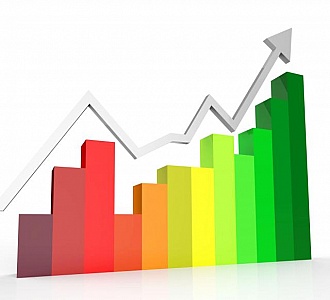
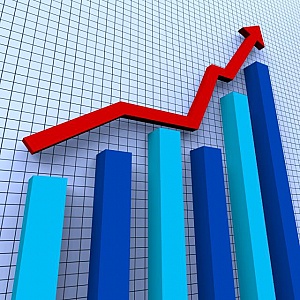
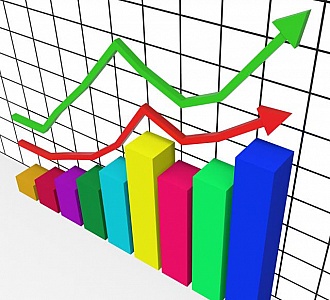
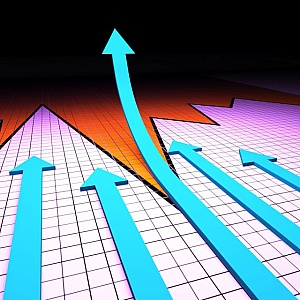
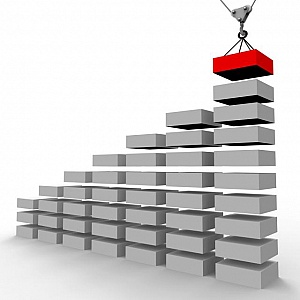
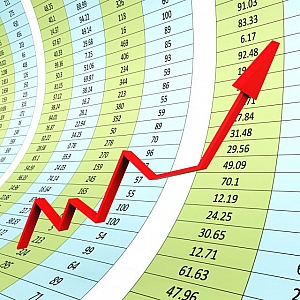
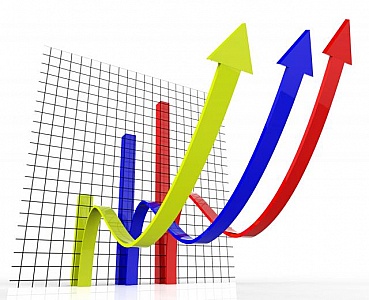
Increasing Graph Shows Financial Report And Biz
Increasing Graph Indicating Progress Report And Financial
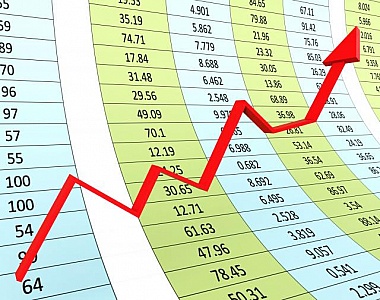
Graph Increasing Indicates Growth Statistics And Increase
Graph Increasing Representing Data Commerce And Finance
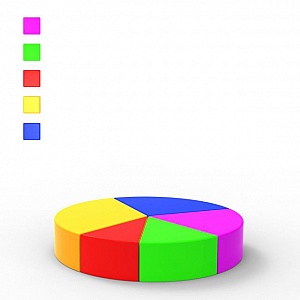
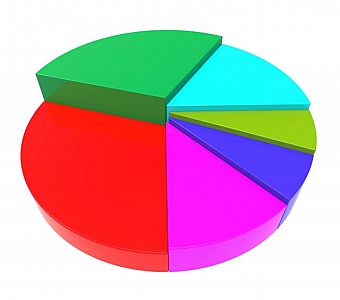
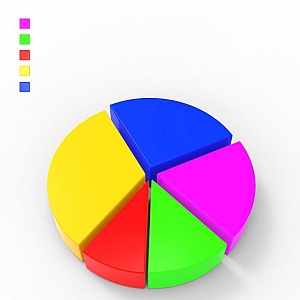
Pie Chart Indicates Data Investment And Trend
Pie Chart Meaning Business Graph And Investment
Graph Increasing Means Trend Up And Grow
Graph Increasing Representing Profit Infograph And Graphics
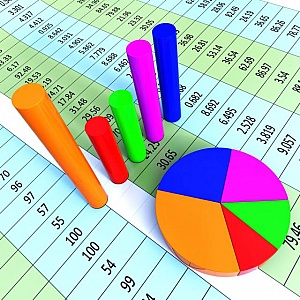
Pie Chart Shows Business Graph And Data
Pie Chart Indicating Business Graph And Document
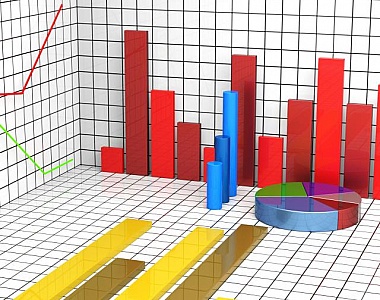
Statistics Charts Represents Graph Graphs And Infochart
Statistics Charts Meaning Stats Statistical And Diagram
Statistics and Figures - Data Analytics Concept
Statistics and Figures - Data Analytics Concept
Decreasing Report Represents Business Graph And Decrease
Decreasing Report Meaning Business Graph And Trend
Increasing Graph Means Progress Report And Advance
Increasing Graph Showing Financial Report And Success
Progress Graph Means Financial Report And Diagram
Progress Graph Representing Infochart Financial And Trend
Graph Increasing Indicates Financial Report And Diagram
Graph Increasing Meaning Financial Report And Statistical
Graph Increasing Represents Marketing Profitable And Improve
Graph Increasing Showing Advance Growth And Lucrative
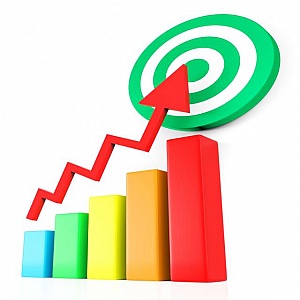
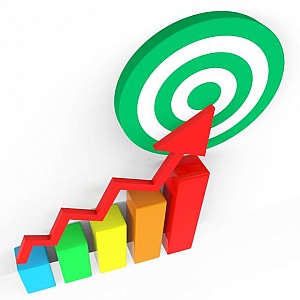
Target Report Represents Business Graph And Analysis
Target Report Meaning Business Graph And Document
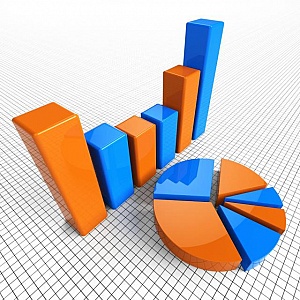
Business Graph Represents Data Graphs And Finance
Business Graph Indicating Infochart Profit And Infograph
Digital Cloud Concept with Lightning Bolt
Digital Cloud Concept with Lightning Bolt
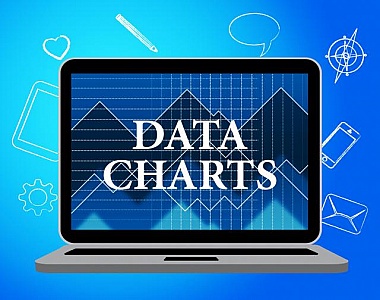
Data Charts Represents Web Site And Facts
Data Charts Meaning Business Graph And Computing
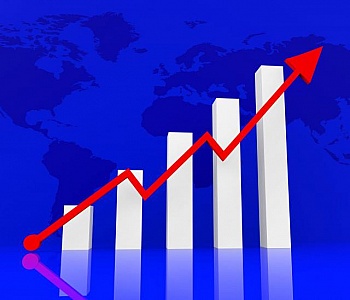
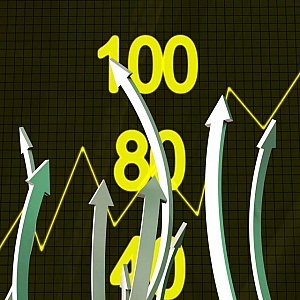
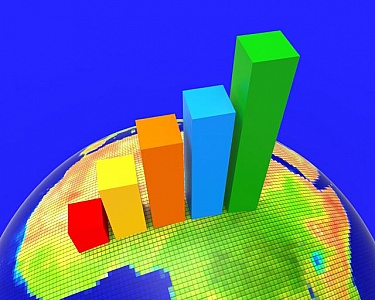
Increase Graph Worldwide Shows Infochart Globalization And Grow
Increase Graph Worldwide Indicating Globally Worldly And Progress
Pie Chart Indicates Financial Report And Charts
Pie Chart Showing Business Graph And Graphic
Pie Chart Represents Financial Report And Data
Pie Chart Indicating Business Graph And Document
Success Graph Means Progress Report And Analysis
Success Graph Showing Progress Report And Graphs
Graph Report Shows Statistic Statistics And Infochart
Graph Report Meaning Data Investment And Analysis
Graph Report Represents Statistic Information And Statistical
Graph Report Indicating Statistical Graphs And Forecast
Increase Graph Construction Represents Investment Infograph And
Increase Graph Construction Indicating Forecast Data And Infograph
Targeting your audience - Arrow and target
Targeting your audience - Arrow and target
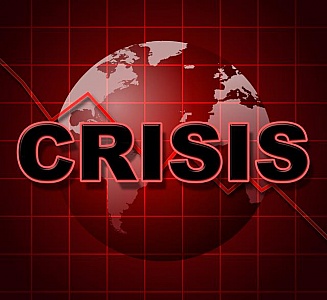
Crisis Graph Represents Investment Finance And Problems
Crisis Graph Indicating Difficult Situation And Issue
Increase Graph Worldwide Shows Graphics Globe And Statistic
Increase Graph Worldwide Representing Data Planet And Upward
Pie Chart Indicates Business Graph And Charts
Pie Chart Showing Progress Report And Graphs
Target Report Indicates Grow Forecast And Profit
Target Report Showing Business Graph And Trend
Business Crash Represents Progress Report And Commerce
Business Crash Indicating Financial Report And Company
Heartbeat Chart Shows Flat Screen And Cardiograph
Heartbeat Chart Meaning Pulse Trace And Cardiac
Business man drawing social network or business connections on w
Business man drawing social network or business connections on world map on a virtual screen board
Targeting your audience - Arrow and target - Colorful version
Targeting your audience - Arrow and target - Colorful version
Music Equaliser Means Sound Track And Amplifier
Music Equaliser Indicating Business Graph And Profit
Panic Graph Represents Infograph Anxiety And Diagram
Panic Graph Showing Statistic Hysteria And Fright
Pie Chart Shows Business Graph And Charting
Pie Chart Indicating Business Graph And Statistic
Graph Report Represents Trend Graphics And Finance
Graph Report Indicating Trend Analysis And Biz
Graph Report Represents Trade Corporate And Finance
Graph Report Meaning Information Financial And Commercial
Simple Digital Cloud Concept with Triangle Mesh
Simple Digital Cloud Concept with Triangle Mesh
Increase Graph Worldwide Shows Graphics Globe And Statistic
Increase Graph Worldwide Representing Data Planet And Upward
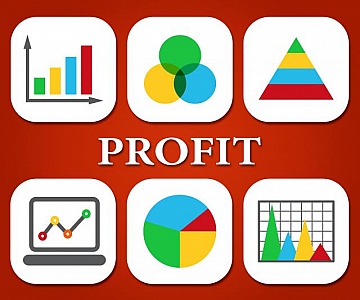
Profit Charts Represents Earnings Graphics And Graph
Profit Charts Indicating Business Graph And Lucrative
Progress Arrows Represents Business Graph And Advance
Progress Arrows Meaning Business Graph And Betterment
Progress Graph Indicates Raise Graphs And Infochart
Progress Graph Showing Financial Report And Graphs
Website Stats Means Business Graph And Analysis
Website Stats Indicating Business Graph And Report
Success Graph Represents Financial Report And Analysis
Success Graph Meaning Financial Report And Upward
Increasing Graph Indicates Growing Upward And Forecast
Increasing Graph Meaning Profit Increase And Upward
Earn Wages Represents Business Graph And Salaries
Earn Graph Meaning Forecast Employed And Infograph
Africa Graph Indicates Financial Report And Analysis
Africa Graph Meaning Progress Report And Grow
Graph Report Indicates Business Statistic And Diagram
Graph Report Meaning Commerce Data And Diagram
Dollar Gain Indicates Business Graph And Banking
Dollar Gain Showing United States And Graph
Find even more royalty free stock photos from the world's best photographers
View
of
3
Try your search on Shutterstock: