Log in
Email
Password
Register
Menu
Explore
Newest photos
Popular photos
Contribute
Submission guidelines
Photographer signup
Photographer login
About
About Freerange
Image license
API
Contact us
Support
Contact support
FAQ
Login
Login
Register
Search all
Photos
Illustrations
Match All
Match Photo ID
Newest
Popular
Select Category
AI Generated
CC0 Images
Editorial and News
Animals & Insects
Architecture
Architectural Details
Arts & Music
Backgrounds & Textures
Cities and Modern Life
Business & Office
Flowers and Plants
France
Food & Drink
Holidays & Occasions
Health and Fitness
Landmarks
Interiors
Illustrations
Industry & Agriculture
Landscapes & Nature
Letters and Numbers
Objects
Other
Military
People
Signs & Symbols
Sky and Clouds
Space
Sports & Recreation
Technology
Wallpapers
Free Stock Images
Sponsored images from Shutterstock
View footage results
Click to save 15% sitewide with code
FREERANGE15OFF
View More
287 free graphs photos from Freerange
Filter results
Popular
Most Viewed
Newest Photos
All licenses
Freerange
CC0
Photos & Illustrations
Photos
Illustrations
Per Page
25
50
100
Data Analytics Concept
Data Analytics Concept
Medical Technology - MedTech Market - Healthcare
Medical Technology - MedTech Market - Healthcare
Group of office mates gathered around a computer screen
Business, work. People in the office - mostly women - after hours, looking at a laptop screen
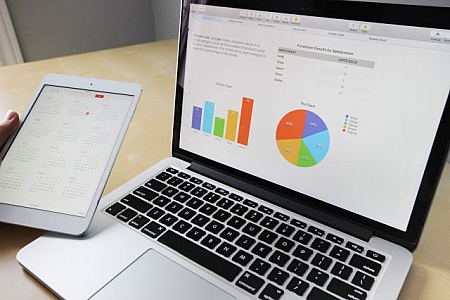
Analyzing digital statistics on laptop and tablet
This image shows a professional comparison of digital statistics on a laptop and tablet, highlighting data analysis
Hand on a laptop with charts and graphs
Close up of a person s hands typing on the laptop keyboard on wooden table
Finance Professional - Broker - Financial Advisor - Analyst - CF
Finance Professional - Broker - Financial Advisor - Analyst - CFA - Investor - Activist - Trader - With Copyspace
Multiple financial graphs on a computer screen displaying data trends.
This image shows several financial graphs on a computer screen, illustrating various data trends and market analyses. It conveys a sense of precision and analytics, portraying the dynamic nature of financial markets in a detailed, professional manner.
Finance Professional - Broker - Financial Advisor - Analyst - CF
Finance Professional - Broker - Financial Advisor - Analyst - CFA - CFO - Investor - Activist
Medical Technology Concept - Beating Heart - Cardiology - Health
Medical Technology Concept - Beating Heart - Cardiology - Healthcare
Finance Professional - Broker - Financial Advisor - Analyst - CF
Finance Professional - Broker - Financial Advisor - Analyst - CFA - CFO - Investor - Activist - With Copyspace
Healthcare Technology Concept
Healthcare Technology Concept, Human Body
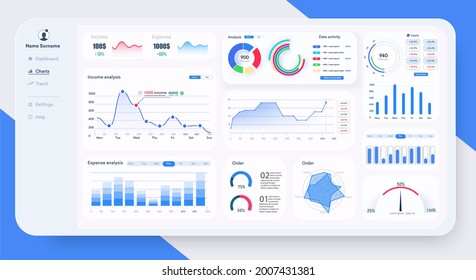
Computer Screen Displaying Multitude of Data
A computer screen shows a large amount of data, including charts, graphs, tables, and text. The data appears to be related to analytics, statistics, or research.
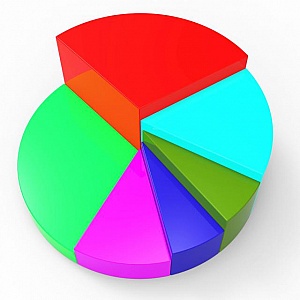
Large Screen Displaying Pie Chart Analysis
A large screen is showcasing a detailed pie chart, depicting data analysis and percentage breakdown of different categories. The chart is clear and easily readable, providing valuable insights and information at a glance.
Laptop with graphs and charts on screen
Open laptop with financial graphs and charts displayed on screen suggesting productivity and analysis
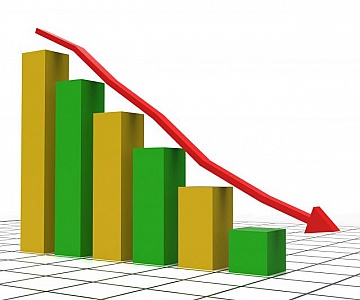
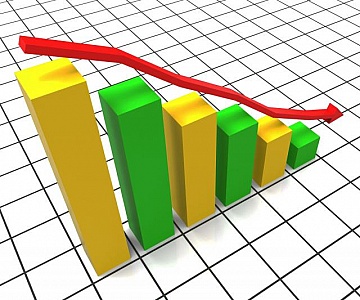
Decreasing Report Shows Graphic Analysis And Graphs
Decreasing Report Meaning Graphic Statistics And Trend
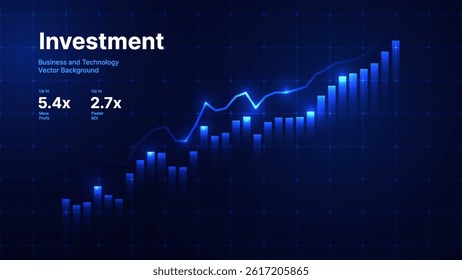
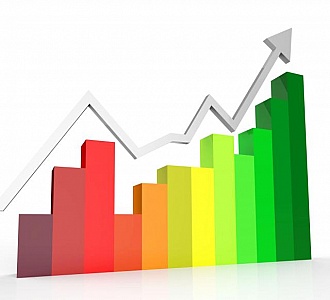
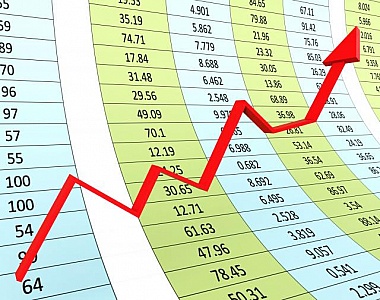
Increasing Graph Shows Financial Report And Biz
Increasing Graph Indicating Progress Report And Financial
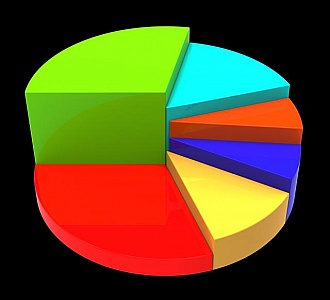
Pie Chart Indicates Data Investment And Trend
Pie Chart Meaning Business Graph And Investment
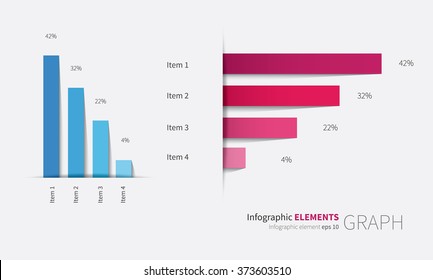
Various business graphs and charts background
Various business graphs and charts on green and blue background
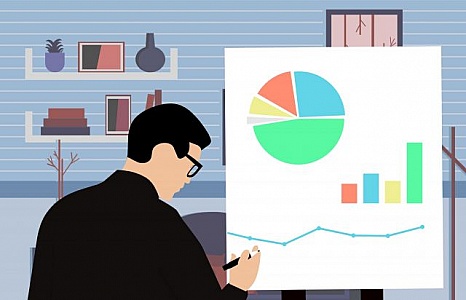
Business planning
Illustration of using charts and graphs to plan a business strategy
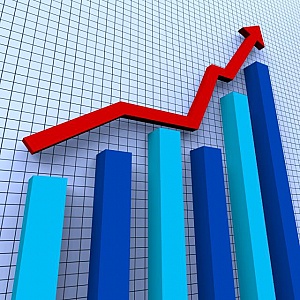
Graph Increasing Means Trend Up And Grow
Graph Increasing Representing Profit Infograph And Graphics
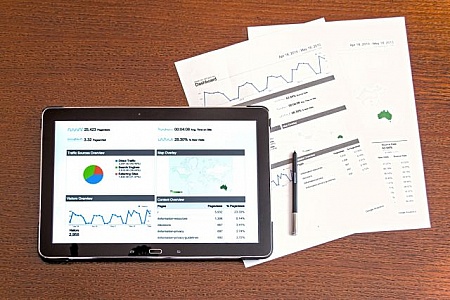
Financial Reports with charts and graphs
Overhead view of computer tablet with charts and graphs on screen with two print-out papers on wooden table
Pie Chart Shows Business Graph And Data
Pie Chart Indicating Business Graph And Document
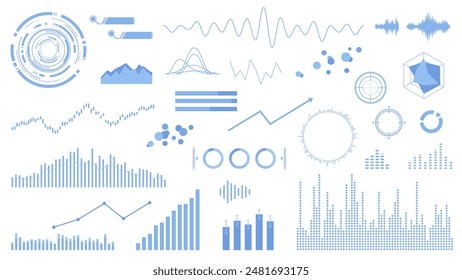
Statistics Charts Represents Graph Graphs And Infochart
Statistics Charts Meaning Stats Statistical And Diagram
Decreasing Report Represents Business Graph And Decrease
Decreasing Report Meaning Business Graph And Trend
Man analyzing data on tablet
Professional analyzing business data on a digital tablet Includes pie charts and graphs
system integration
Business man with screen full of charts and graphs.
Bold Red and White Numbers on Black Background
Illuminated VU meters for audio playback and recording
Clean modern workstation with computer, plants, sunlight
A clean modern workstation illuminated by sunlight, featuring a computer, potted plants, books, and a cup of coffee, representing a productive and aesthetic workspace.
Progress Graph Means Financial Report And Diagram
Progress Graph Representing Infochart Financial And Trend
Increasing Graph Means Progress Report And Advance
Increasing Graph Showing Financial Report And Success
Online Banking
Online Banking
Financial Audit Concept
Financial Audit Concept
Graph Increasing Indicates Financial Report And Diagram
Graph Increasing Meaning Financial Report And Statistical
Medical Technology Concept - Cardiology - Bionics - Healthcare.j
Medical Technology Concept - Cardiology - Bionics - Healthcare - With Copyspace
Business Graph Represents Data Graphs And Finance
Business Graph Indicating Infochart Profit And Infograph
Target Report Represents Business Graph And Analysis
Target Report Meaning Business Graph And Document
Graph Increasing Represents Marketing Profitable And Improve
Graph Increasing Showing Advance Growth And Lucrative
Simple Lightbulb Illustration
Simple Lightbulb Illustration
Data Charts Represents Web Site And Facts
Data Charts Meaning Business Graph And Computing
Financial Analysis
Financial Analysis
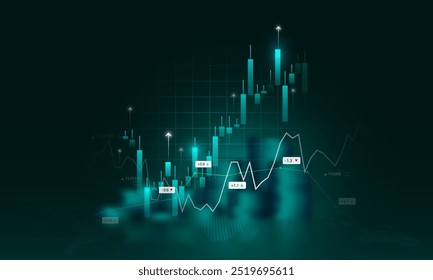
Stock Graphs
Close up of screen with stock chart graph
Financial Planning - Financial Analysis - Budget - Budgeting - C
Financial Planning - Financial Analysis - Budget - Budgeting - Concept
Increase Graph Worldwide Shows Infochart Globalization And Grow
Increase Graph Worldwide Indicating Globally Worldly And Progress
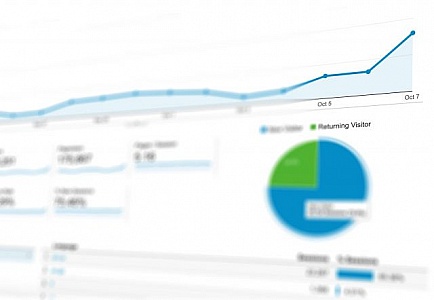
Analytics chart
Blurry View of graphs and charts of presentation
Silhouettes of business people
Silhouettes of business people with graphs and charts in the background
Charts and infographics on desk
Worker looking at infographics, charts and graphs on paper, with smartphone.
Business people during a meeting in office
Person pointing at whiteboard and explaining graphs to colleagues at meeting in office
Businesswomen with whiteboard
Female colleagues discussing ideas and plans with whiteboard during a meeting in office
Isolated Light Bulb
Isolated Light Bulb
Mobile Payments - Mobile Money Transfers
Mobile Payments - Mobile Money Transfers
Find even more royalty free stock photos from the world's best photographers
View
of
6
Try your search on Shutterstock: