Log in
Email
Password
Register
Menu
Explore
Newest photos
Popular photos
Contribute
Submission guidelines
Photographer signup
Photographer login
About
About Freerange
Image license
API
Contact us
Support
Contact support
FAQ
Login
Login
Register
Search all
Photos
Illustrations
Match All
Match Photo ID
Newest
Popular
Select Category
AI Generated
CC0 Images
Editorial and News
Animals & Insects
Architecture
Architectural Details
Arts & Music
Backgrounds & Textures
Cities and Modern Life
Business & Office
Flowers and Plants
France
Food & Drink
Holidays & Occasions
Health and Fitness
Landmarks
Interiors
Illustrations
Industry & Agriculture
Landscapes & Nature
Letters and Numbers
Objects
Other
Military
People
Signs & Symbols
Sky and Clouds
Space
Sports & Recreation
Technology
Wallpapers
Free Stock Images
Sponsored images from iStock
View footage results
Click to save 15% sitewide with code
FREERANGE15
View More
362 free increase from Freerange
Filter results
Popular
Most Viewed
Newest Photos
All licenses
Freerange
CC0
Photos & Illustrations
Photos
Illustrations
Per Page
25
50
100
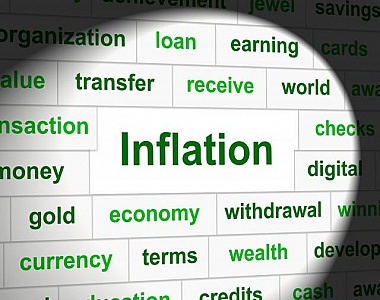
Finance Inflation Represents Economic Profit And Increase
Finance Inflation Indicating Fiscal Rise And Growth
Time To Save Shows Increase Savings And Finances
Time To Save Representing Capital Wealthy And Invest
Cut Costs Represents Financial Balance And Expenditure
Cut Costs Meaning Accounts Price And Wealthy
Lightbulb Save Indicates Savings Investment And Capital
Lightbulb Save Showing Investment Bright And Finances
Save Tick Represents Pass Financial And Investment
Save Tick Meaning Financial Yes And Passed
Population Increase Indicates Group Up And Success
Population Increase Showing Progress Grow And Upwards
Dollar Savings Represents Revenue Increase And Save
Dollar Savings Indicating American Dollars And Financial
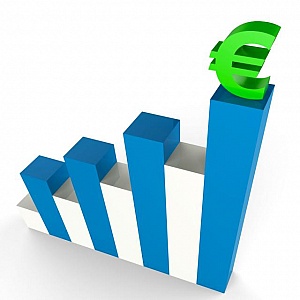
Euro Gain Indicates Financial Report And Advance
Euro Gain Representing Business Graph And Infograph
File Report Indicates Business Graph And Analysis
File Report Showing Business Graph And Information
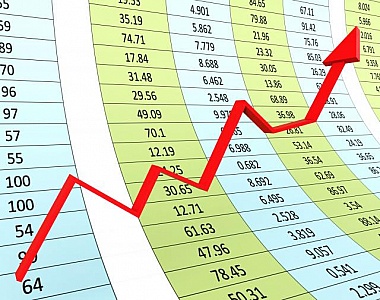
Progress Graph Means Financial Report And Diagram
Progress Graph Representing Infochart Financial And Trend
Progress Report Represents Business Graph And Analysis
Progress Report Showing Business Graph And Graphic
Real Estate Mortgage Shows Pre Payment And Building
Real Estate Mortgage Representing On The Market And Debt
Real Estate Mortgage Represents On The Market And Advance
Real Estate Mortgage Meaning On The Market And Debt
Growth Thermometer Indicates Rise Scale And Development
Thermometer Growth Showing Scale Rise And Develop
Growth Bubble Means Improvement Rise And Development
Growth Bubble Meaning Improvement Rise And Development
Profit Arrow Shows Sales And Earnings Projection
Profit Arrow Showing Sales And Earnings Projection
House Icon Showing House Price Going Up
House Icon Showing House Or Building Price Going Up
Road Marking On Arrow Shows Direction Or Upward
Road Marking On Arrow Showing Direction Or Upward
Bottom Line Message Means Net Earnings Per Share
Bottom Line Message Meaning Net Earnings Per Share
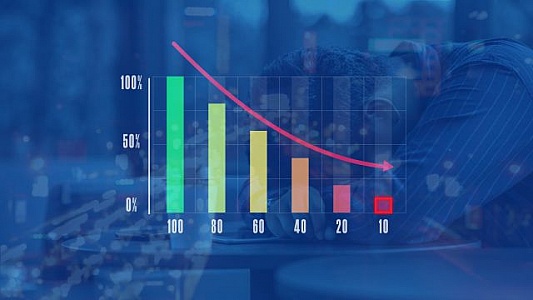
Multi colors Infographics histogram or Infographics bar chart
Multi colors Infographics histogram or Infographics bar chart with arrow down and Stressed businessman feeling down in blue background, financial crisis and economic crisis concept
Decrease Reducing Keys Shows Decreasing Or Down Online
Decrease Reducing Keys Showing Decreasing Or Down Online
Spending Graph Phone Means Costs Expenses And Outlay
Spending Graph Phone Meaning Costs Expenses And Outlay
Euro Chart Graph Displays Increasing European Economy
Euro Chart Graph Displaying Increasing European Economy
Salary Chart Graph Displays Increase Earn Cash Wealth Revenue
Salary Chart Graph Displaying Increase Earn Cash Wealth Revenue
Twenty Fifteen Graph Chart Displays Increase In 2015
Twenty Fifteen Graph Chart Displaying Increase In 2015
Find even more royalty free stock photos from the world's best photographers
View
of
15
Try your search on iStock: