Log in
Email
Password
Register
Menu
Explore
Newest photos
Popular photos
Contribute
Submission guidelines
Photographer signup
Photographer login
About
About Freerange
Image license
API
Contact us
Support
Contact support
FAQ
Login
Login
Register
Search all
Photos
Illustrations
Match All
Match Photo ID
Newest
Popular
Select Category
AI Generated
CC0 Images
Editorial and News
Animals & Insects
Architecture
Architectural Details
Arts & Music
Backgrounds & Textures
Cities and Modern Life
Business & Office
Flowers and Plants
France
Food & Drink
Holidays & Occasions
Health and Fitness
Landmarks
Interiors
Illustrations
Industry & Agriculture
Landscapes & Nature
Letters and Numbers
Objects
Other
Military
People
Signs & Symbols
Sky and Clouds
Space
Sports & Recreation
Technology
Wallpapers
Free Stock Images
Sponsored images from iStock
View footage results
Click to save 15% sitewide with code
FREERANGE15
View More
234 free charts from Freerange
Filter results
Popular
Most Viewed
Newest Photos
All licenses
Freerange
CC0
Photos & Illustrations
Photos
Illustrations
Per Page
25
50
100
Bookkeeping - Accounting - Concept
Bookkeeping - Accounting - Concept
Online Banking - Online Financial Services - Secure Financial Tr
Online Banking - Online Financial Services - Secure Financial Transactions
Online Payments - Online Payments Technology
Online Payments - Online Payments Technology
View from behind young man and looking at the noticeboard
Back view of a young man and a woman looking at the noticeboard in the office
Human - Machine Interface - The Rise of Artificial Intelligence
Human - Machine Interface - The Rise of Artificial Intelligence - Machine Learning
DNA - Genetic Sequencing Concept - Red Queen
DNA - Genetic Sequencing Concept - Red Queen
investment Protection
Illustration of hands protecting cash investment with charts and diagrams
Expense Chart on Phone Screen
Rear View of blonde woman sitting and using her iPhone to check financial expense
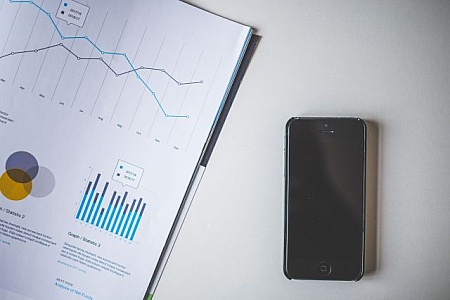
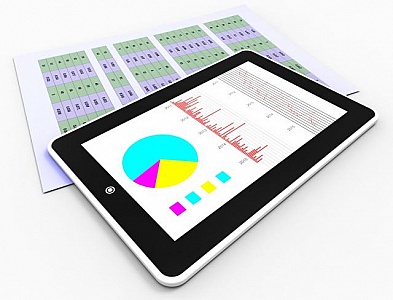
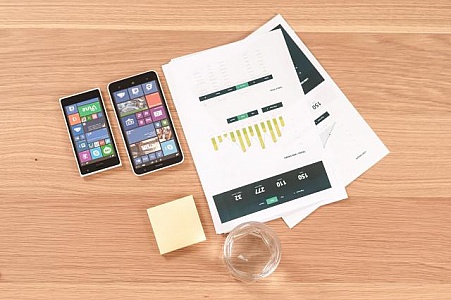
Graph Chart and iPhone
Overhead view of graphic chart document with mobile phone on white table
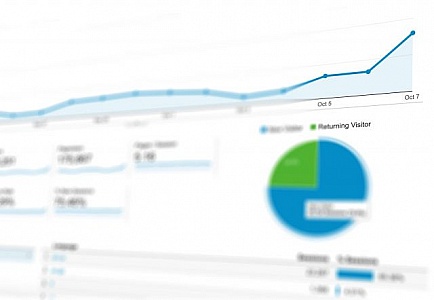
Analytics chart
Blurry View of graphs and charts of presentation
Male corporate manager with whiteboard in office
Rear view of young person in blue shirt with short hair looking at the graphs on white board
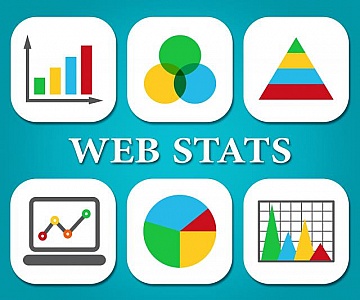
Web Stats Indicates Business Graph And Analysing
Web Stats Representing Business Graph And Forecast
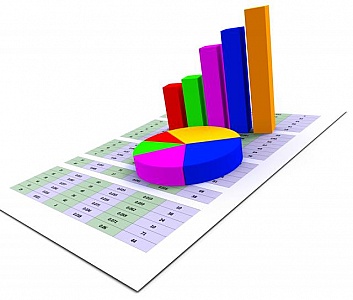
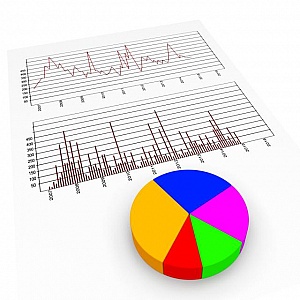
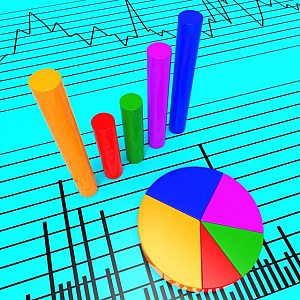
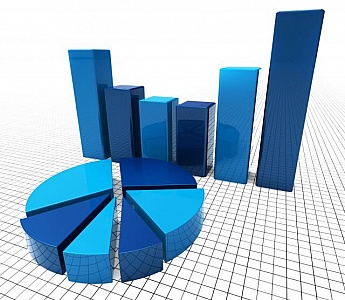
Pie Chart Indicates Stat Graphics And Infochart
Pie Chart Meaning Business Graph And Forecast
Online Reports Represents Business Graph And Analysis
Online Reports Meaning Tablet Pc And Infograph
Graph Report Means Biz Trade And Diagram
Graph Report Indicating Trend Financial And Infograph
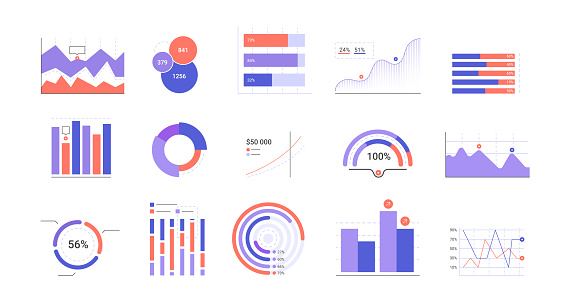
data analysis
Business man illustration with business metrics charts and displays.
Online Payments - Mobile Payments Technology
Online Payments - Mobile Payments Technology
Silhouettes of business people
Silhouettes of business people with graphs and charts in the background
Pyramid vector icons
Pyramid vector icons on green background
Digital Connections Concept
Digital Connections Concept
Businessman hand with marker pen and whiteboard - b&w
Black and white view of young person writing on the whiteboard in office
People working in a group
Office and business. People at work with charts and graphs.
Two business women with marker pen and whiteboard
Young Caucasian and Black woman writing on the whiteboard during a meeting in office
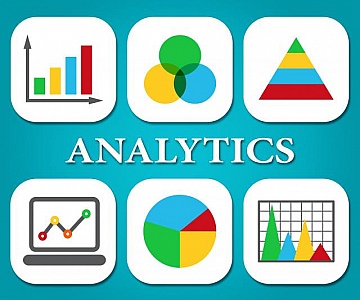
Analytics Charts Represents Business Graph And Statistics
Analytics Charts Indicating Business Graph And Forecast
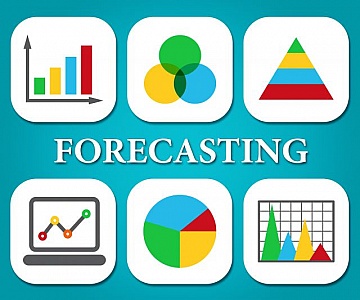
Forcasting Charts Shows Business Graph And Statistic
Forcasting Charts Indicating Business Graph And Statistics
Finances Graph Means Profit Commerce And Figures
Finances Graph Indicating Graphs Forecast And Business
Charts File Shows Graph Documents 3d Rendering
Charts File Showing Graph Documents 3d Rendering
Savings File Represents Organization Files And Monetary 3d Rende
Savings File Meaning Money Binder And Graphic 3d Rendering
Graph Report Means Trend Graphs And Graphic
Graph Report Showing Statistical Information And Statistics
Two mobile devices and reprorts
Two mobile smartphones and a pile of business metric reports.
Over the head view of financial symbols being drawn on white notebook
Over the head view of financial symbols being drawn on white notebook with black pen alongside a coffee mug and leaves on white table
African businessman
Illustration of businessman with charts and diagrams
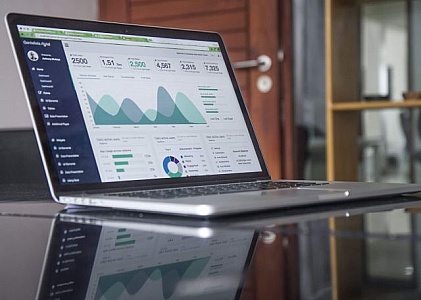
Financial Charts on Laptop
Close up of Macbook Laptop with Financial Charts and Graphs on Screen
Woman looking a charts on corkboard
Business situations. People in the office
Designer with whiteboard in office
Rear view of young developer or designer in blue shirt with short hair looking at the graphs on white board
Businesswomen with whiteboard
Female colleagues discussing ideas and plans with whiteboard during a meeting in office
Female corporate manager with graph chart
Young businesswoman speaking at presentation and pointing finger to the chart in office
Two business women with marker pen and whiteboard
Young Caucasian and Black woman writing on the whiteboard during a meeting in office
Two business women with marker pen and whiteboard
Young Caucasian and Black woman writing on the whiteboard during a meeting in office
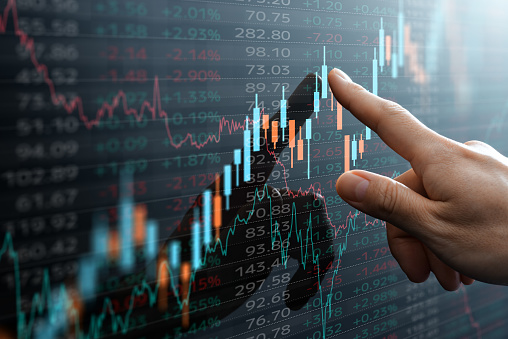
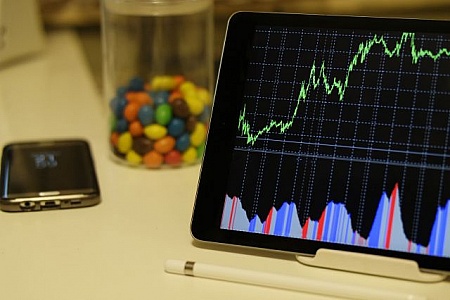
Tablet displaying stock market data next to candy
An electronic tablet with a colorful display of the stock market charts, indicating financial analysis with candy jar blurred in the background
Debt Character Shows Lack Of Success And Accounting 3d Rendering
Debt Character Indicating Lack Of Success And Business Person 3d Rendering
Graph Report Shows Infochart Document And Investment
Graph Report Indicating Commercial Information And Finance
Graph Report Represents Trend Graphics And Finance
Graph Report Indicating Trend Analysis And Biz
Graph Report Means Finance Data And Information
Graph Report Indicating Profit Data And Statistical
Statistics Data Indicates Stats Bytes And Reports
Stats Data Representing Statistical Analysis And Facts
Graph Report Means Finance Data And Information
Graph Report Indicating Profit Data And Statistical
Graph Report Represents Data Corporate And Forecast
Graph Report Showing Data Finance And Corporation
Calculate Statistics Means Charting Figures And Calculator
Calculate Statistics Showing Data Computes And Figures
Graph Report Represents Information Corporation And Graphic
Graph Report Meaning Business Analysis And Infograph
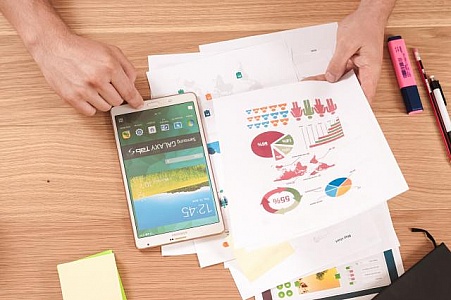
Charts and infographics on desk
Worker looking at infographics, charts and graphs on paper, with smartphone.
Find even more royalty free stock photos from the world's best photographers
View
of
5
Try your search on iStock: